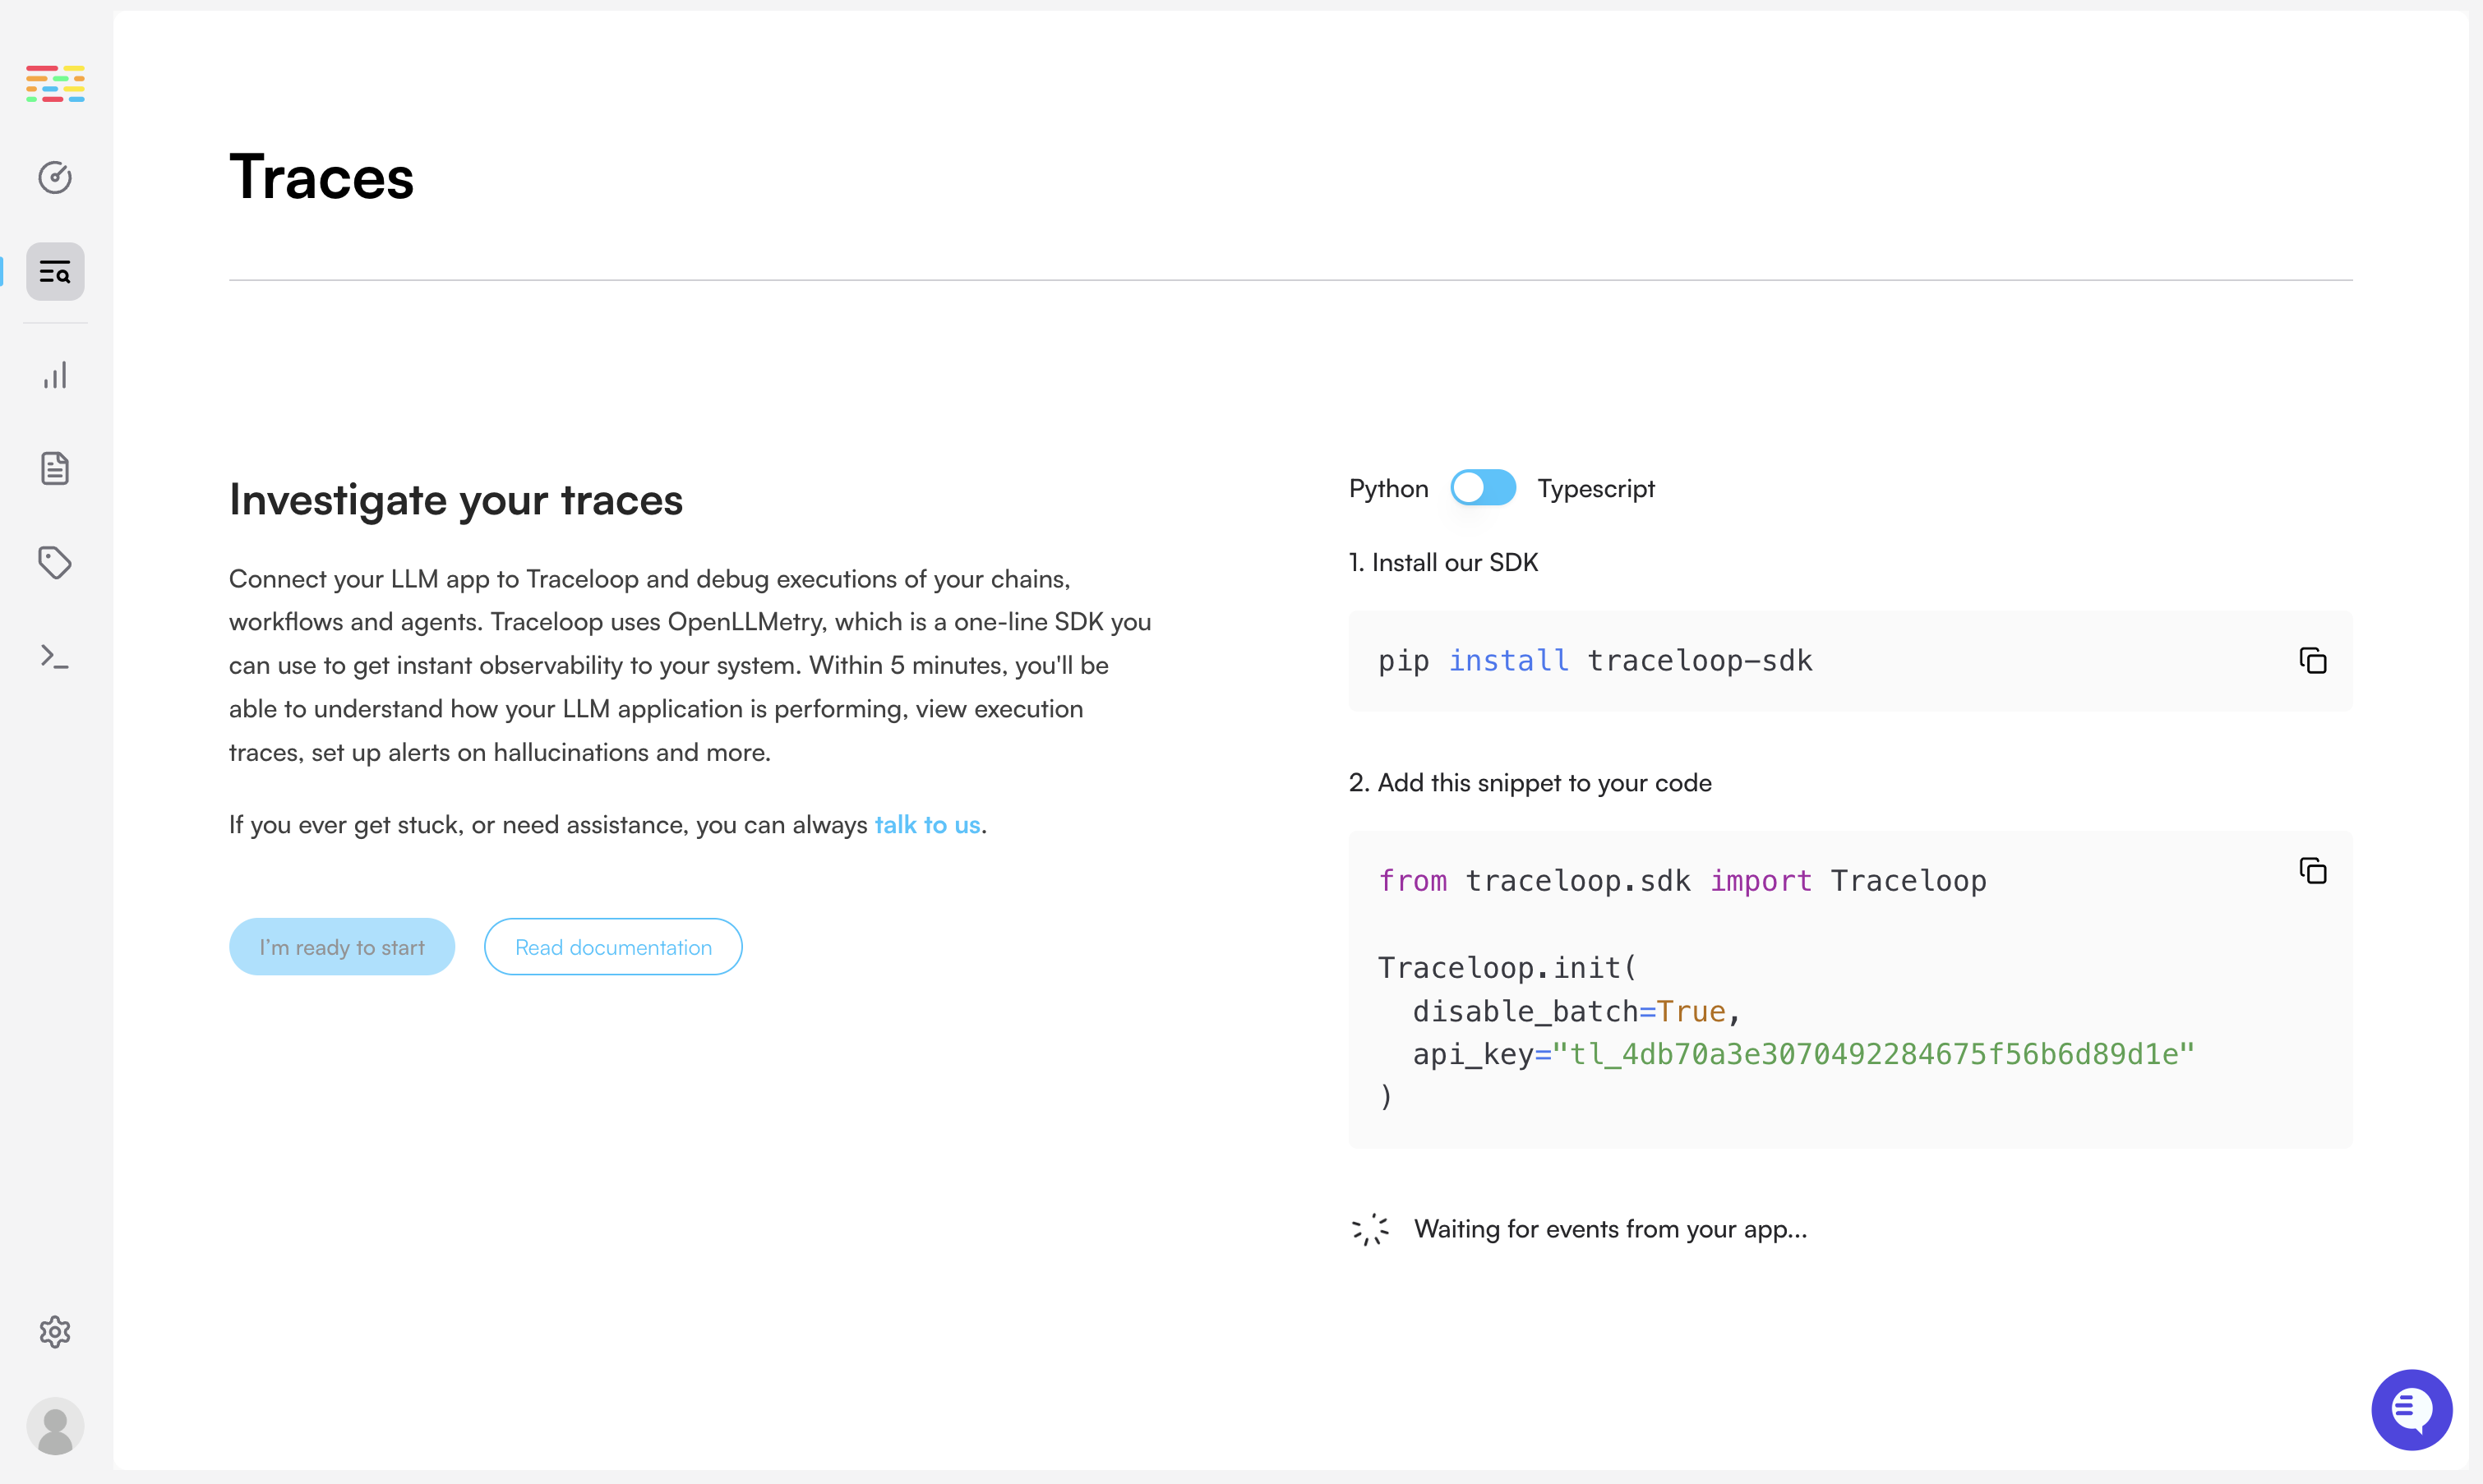
1. Disable batch sending
Sending traces in batch is useful in production, but can be confusing if you’re working locally. Make sure you’ve disabled batch sending.2. Check the logs
When Traceloop initializes, it logs a message to the console, specifying the endpoint that it uses. If you don’t see that, you might not be initializing the SDK properly.
Traceloop exporting traces to https://api.traceloop.com
3. (TS/JS only) Fix known instrumentation issues
If you’re using Typescript or Javascript, make sure to import traceloop before any other LLM libraries. This is because traceloop needs to instrument the libraries you’re using, and it can only do that if it’s imported first.4. Is your library supported yet?
Check out OpenLLMetry or OpenLLMetry-JS README files to see which libraries and versions are currently supported. Contributions are always welcome! If you want to add support for a library, please open a PR.5. Try outputting traces to the console
Use theConsoleExporter and check if you see traces in the console.


