Documentation Index
Fetch the complete documentation index at: https://www.traceloop.com/docs/llms.txt
Use this file to discover all available pages before exploring further.
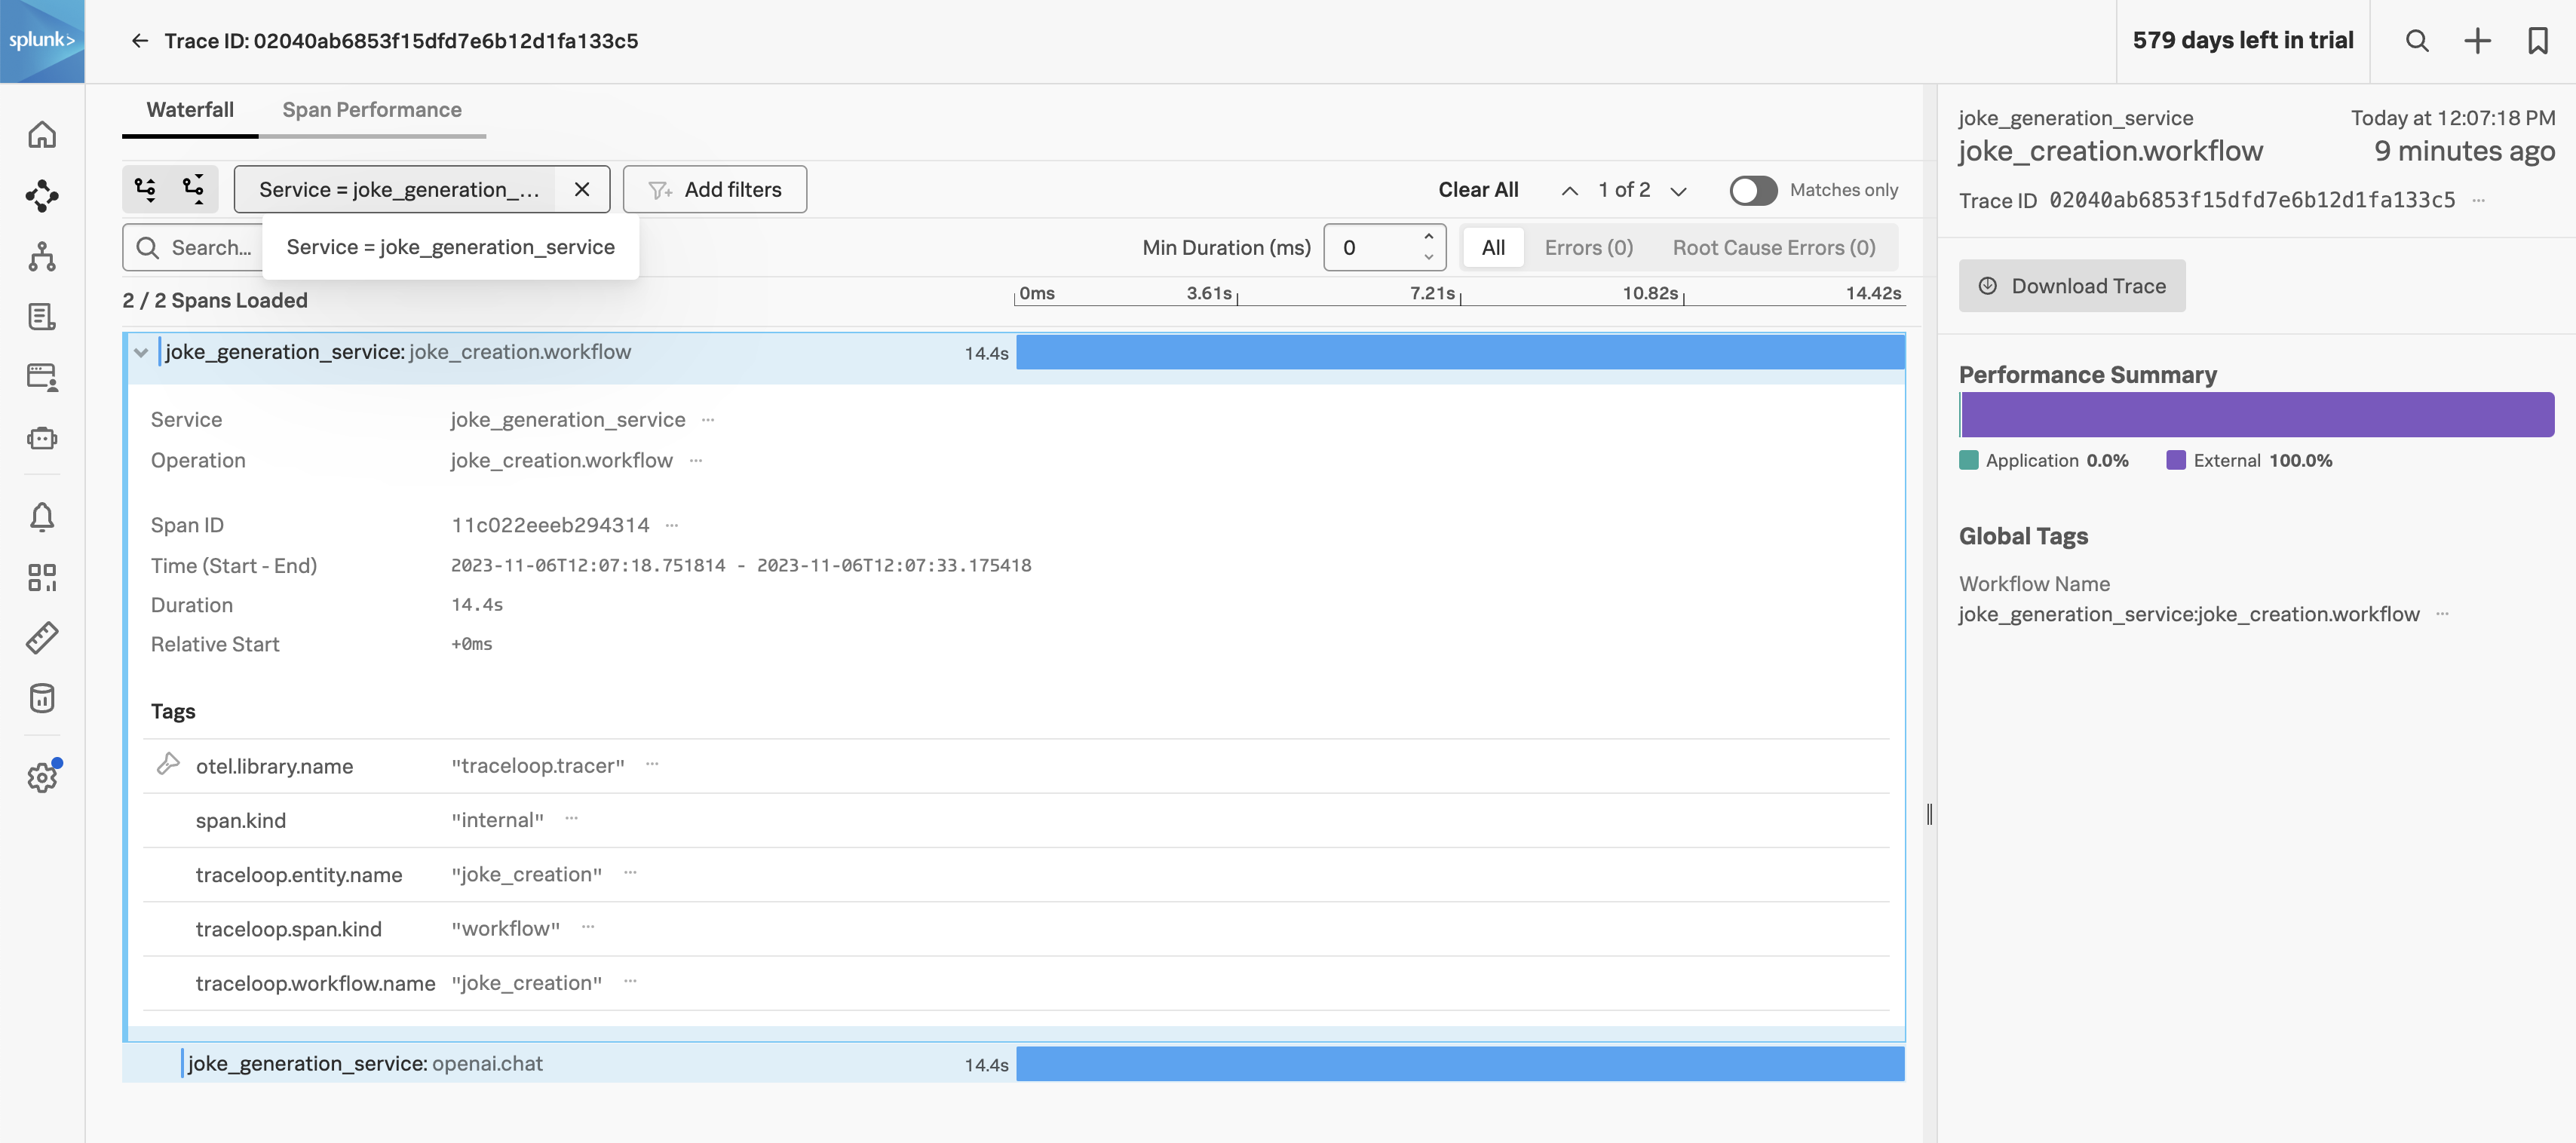
Collecting and analyzing LLM traces in Splunk Observability Cloud can be achieved by configuring the TRACELOOP_BASE_URL environment variable to point to the Splunk OpenTelemetry Collector OTLP endpoint.
Have the Collector run in agent or gateway mode and ensure the OTLP receiver is configured, see Get data into Splunk Observability Cloud.
receivers:
  otlp:
    protocols:
      grpc:
        endpoint: "0.0.0.0:4317"
      http:
        endpoint: "0.0.0.0:4318"
exporters:
  # Traces
  sapm:
    access_token: "${SPLUNK_ACCESS_TOKEN}"
    endpoint: "https://ingest.${SPLUNK_REALM}.signalfx.com/v2/trace"
    sending_queue:
      num_consumers: 32
otlp is defined in the traces pipeline:
  pipelines:
    traces:
      receivers: [jaeger, otlp, sapm, zipkin]
      processors:
      - memory_limiter
      - batch
      #- resource/add_environment
      exporters: [sapm]
TRACELOOP_BASE_URL environment variable to point to the Splunk OpenTelemetry Collector OTLP endpoint:
TRACELOOP_BASE_URL=http://<splunk-otel-collector>:4318


