This integration requires an OpenTelemetry Collector to route traces between Traceloop OpenLLMetry client and Elastic APM Server.
Elastic APM Server 8.x+ supports OTLP natively.
Quick Start
1
Install OpenLLMetry
Install the Traceloop SDK alongside your LLM provider client:
2
Configure OpenTelemetry Collector
Configure your OpenTelemetry Collector to receive traces from OpenLLMetry and forward them to APM Server.Create an
otel-collector-config.yaml file:3
Initialize Traceloop
Import and initialize Traceloop before any LLM imports:
The
app_name parameter sets the service name visible in Kibana APM’s service list.4
View Traces in Kibana
Navigate to Kibana’s APM interface:
- Open Kibana at
http://localhost:5601 - Go to Observability → APM → Services
- Click on your service name (e.g.,
your-service-name) - View transactions and trace timelines with full LLM metadata
- Model name (
gen_ai.request.model) - Token usage (
gen_ai.usage.input_tokens,gen_ai.usage.output_tokens) - Prompts and completions (configurable)
- Request duration and latency
Environment Variables
Configure OpenLLMetry behavior using environment variables:Using Workflow Decorators
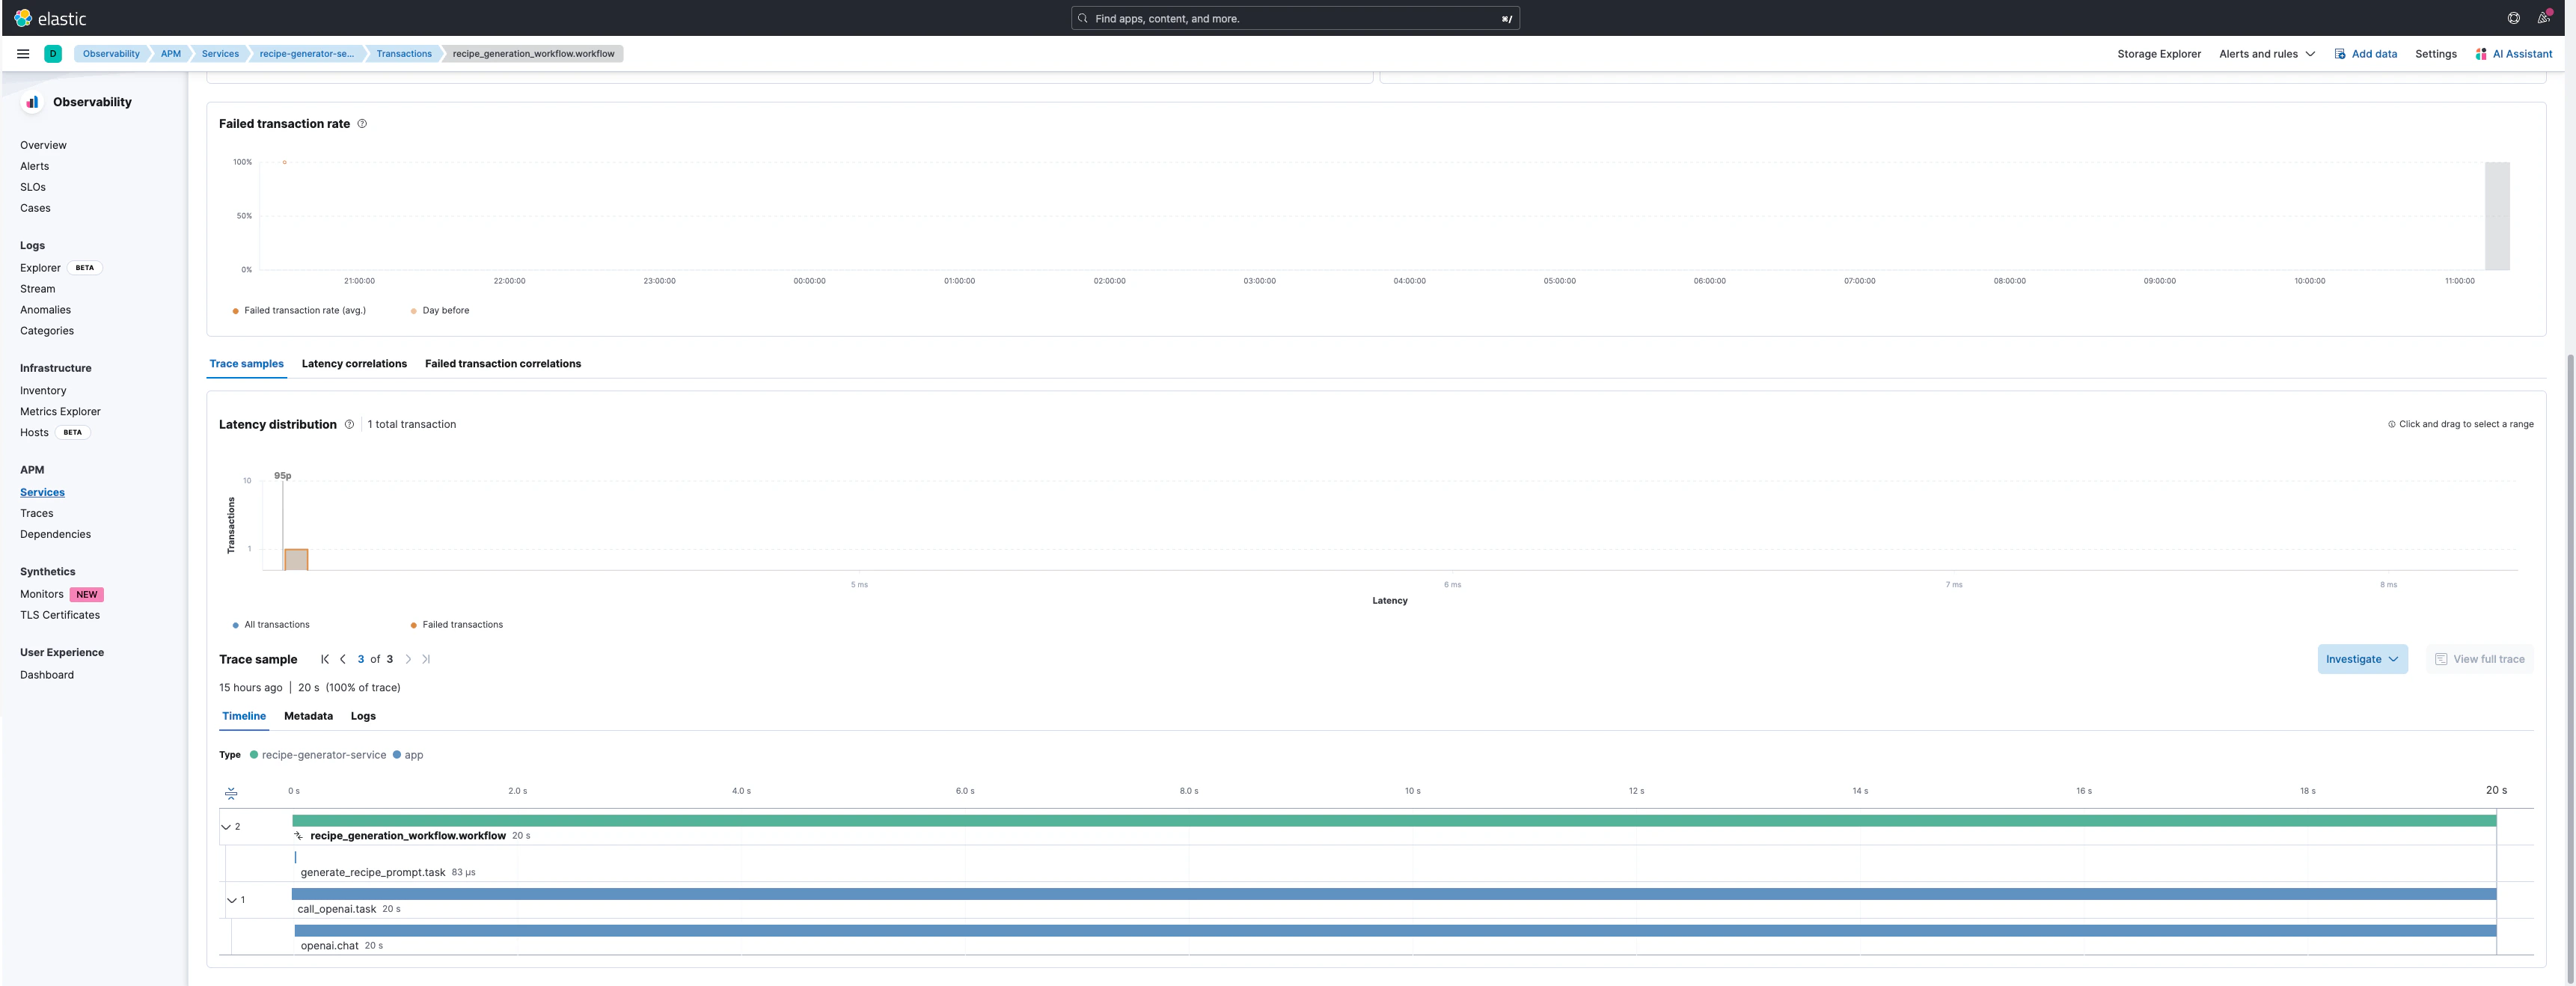
For complex applications with multiple steps, use workflow decorators to create hierarchical traces:recipe_workflow.workflowas the parent transactiongenerate_recipe.taskas a child spanopenai.chat.completionsas the LLM API span with full metadata
Example Trace Visualization
Trace View
Trace Details
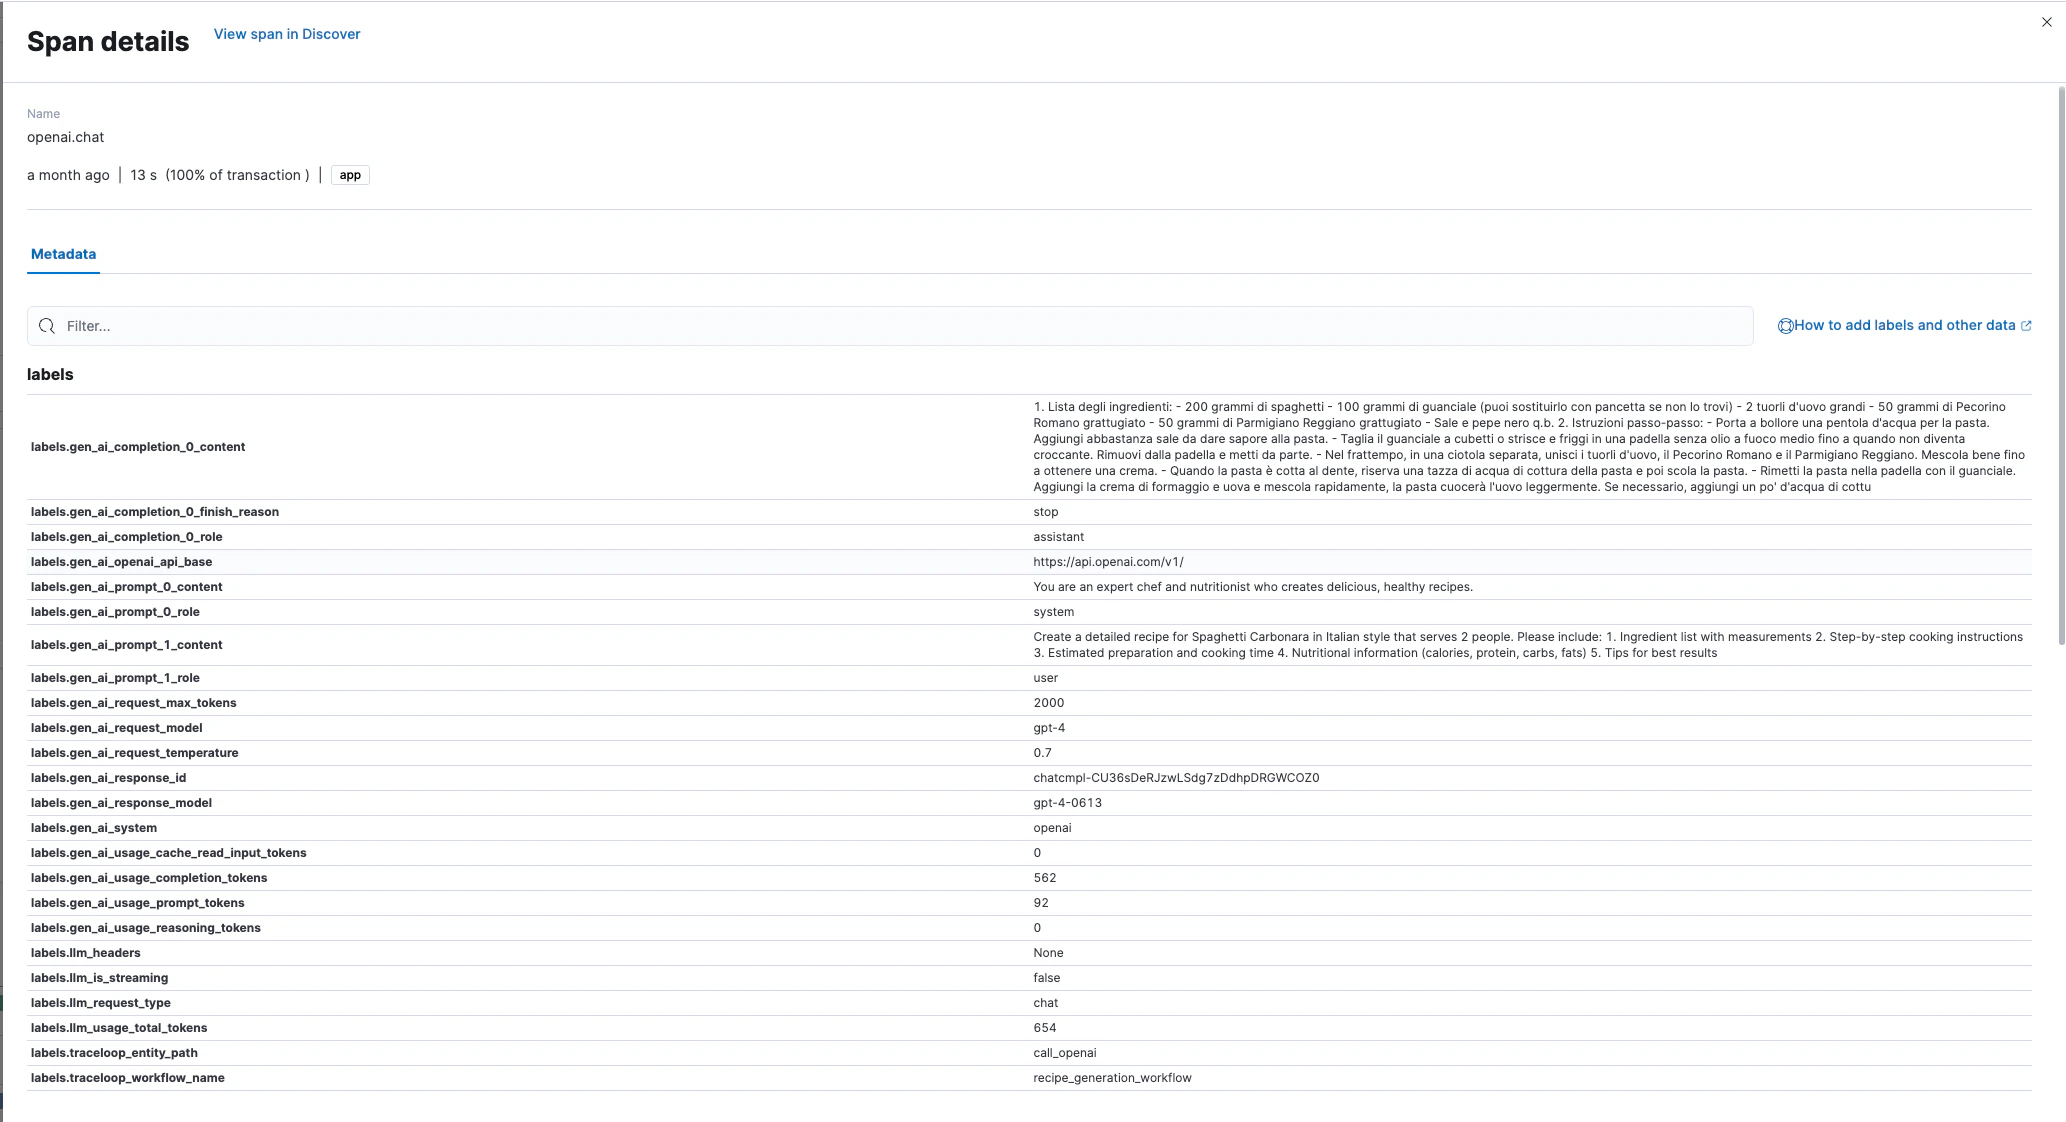
Captured Metadata
OpenLLMetry automatically captures these attributes in each LLM span: Request Attributes:gen_ai.request.model- Model identifiergen_ai.request.temperature- Sampling temperaturegen_ai.system- Provider name (OpenAI, Anthropic, etc.)
gen_ai.response.model- Actual model usedgen_ai.response.id- Unique response identifiergen_ai.response.finish_reason- Completion reason
gen_ai.usage.input_tokens- Input token countgen_ai.usage.output_tokens- Output token countllm.usage.total_tokens- Total tokens
gen_ai.prompt.{N}.content- Prompt messagesgen_ai.completion.{N}.content- Generated completions
Production Considerations
- Content Logging
- Sampling
- Security
Disable prompt/completion logging in production:This prevents sensitive data from being stored in Elasticsearch.