> ## Documentation Index
> Fetch the complete documentation index at: https://www.traceloop.com/docs/llms.txt
> Use this file to discover all available pages before exploring further.
# Troubleshooting
> Not seeing anything? Here are some things to check.
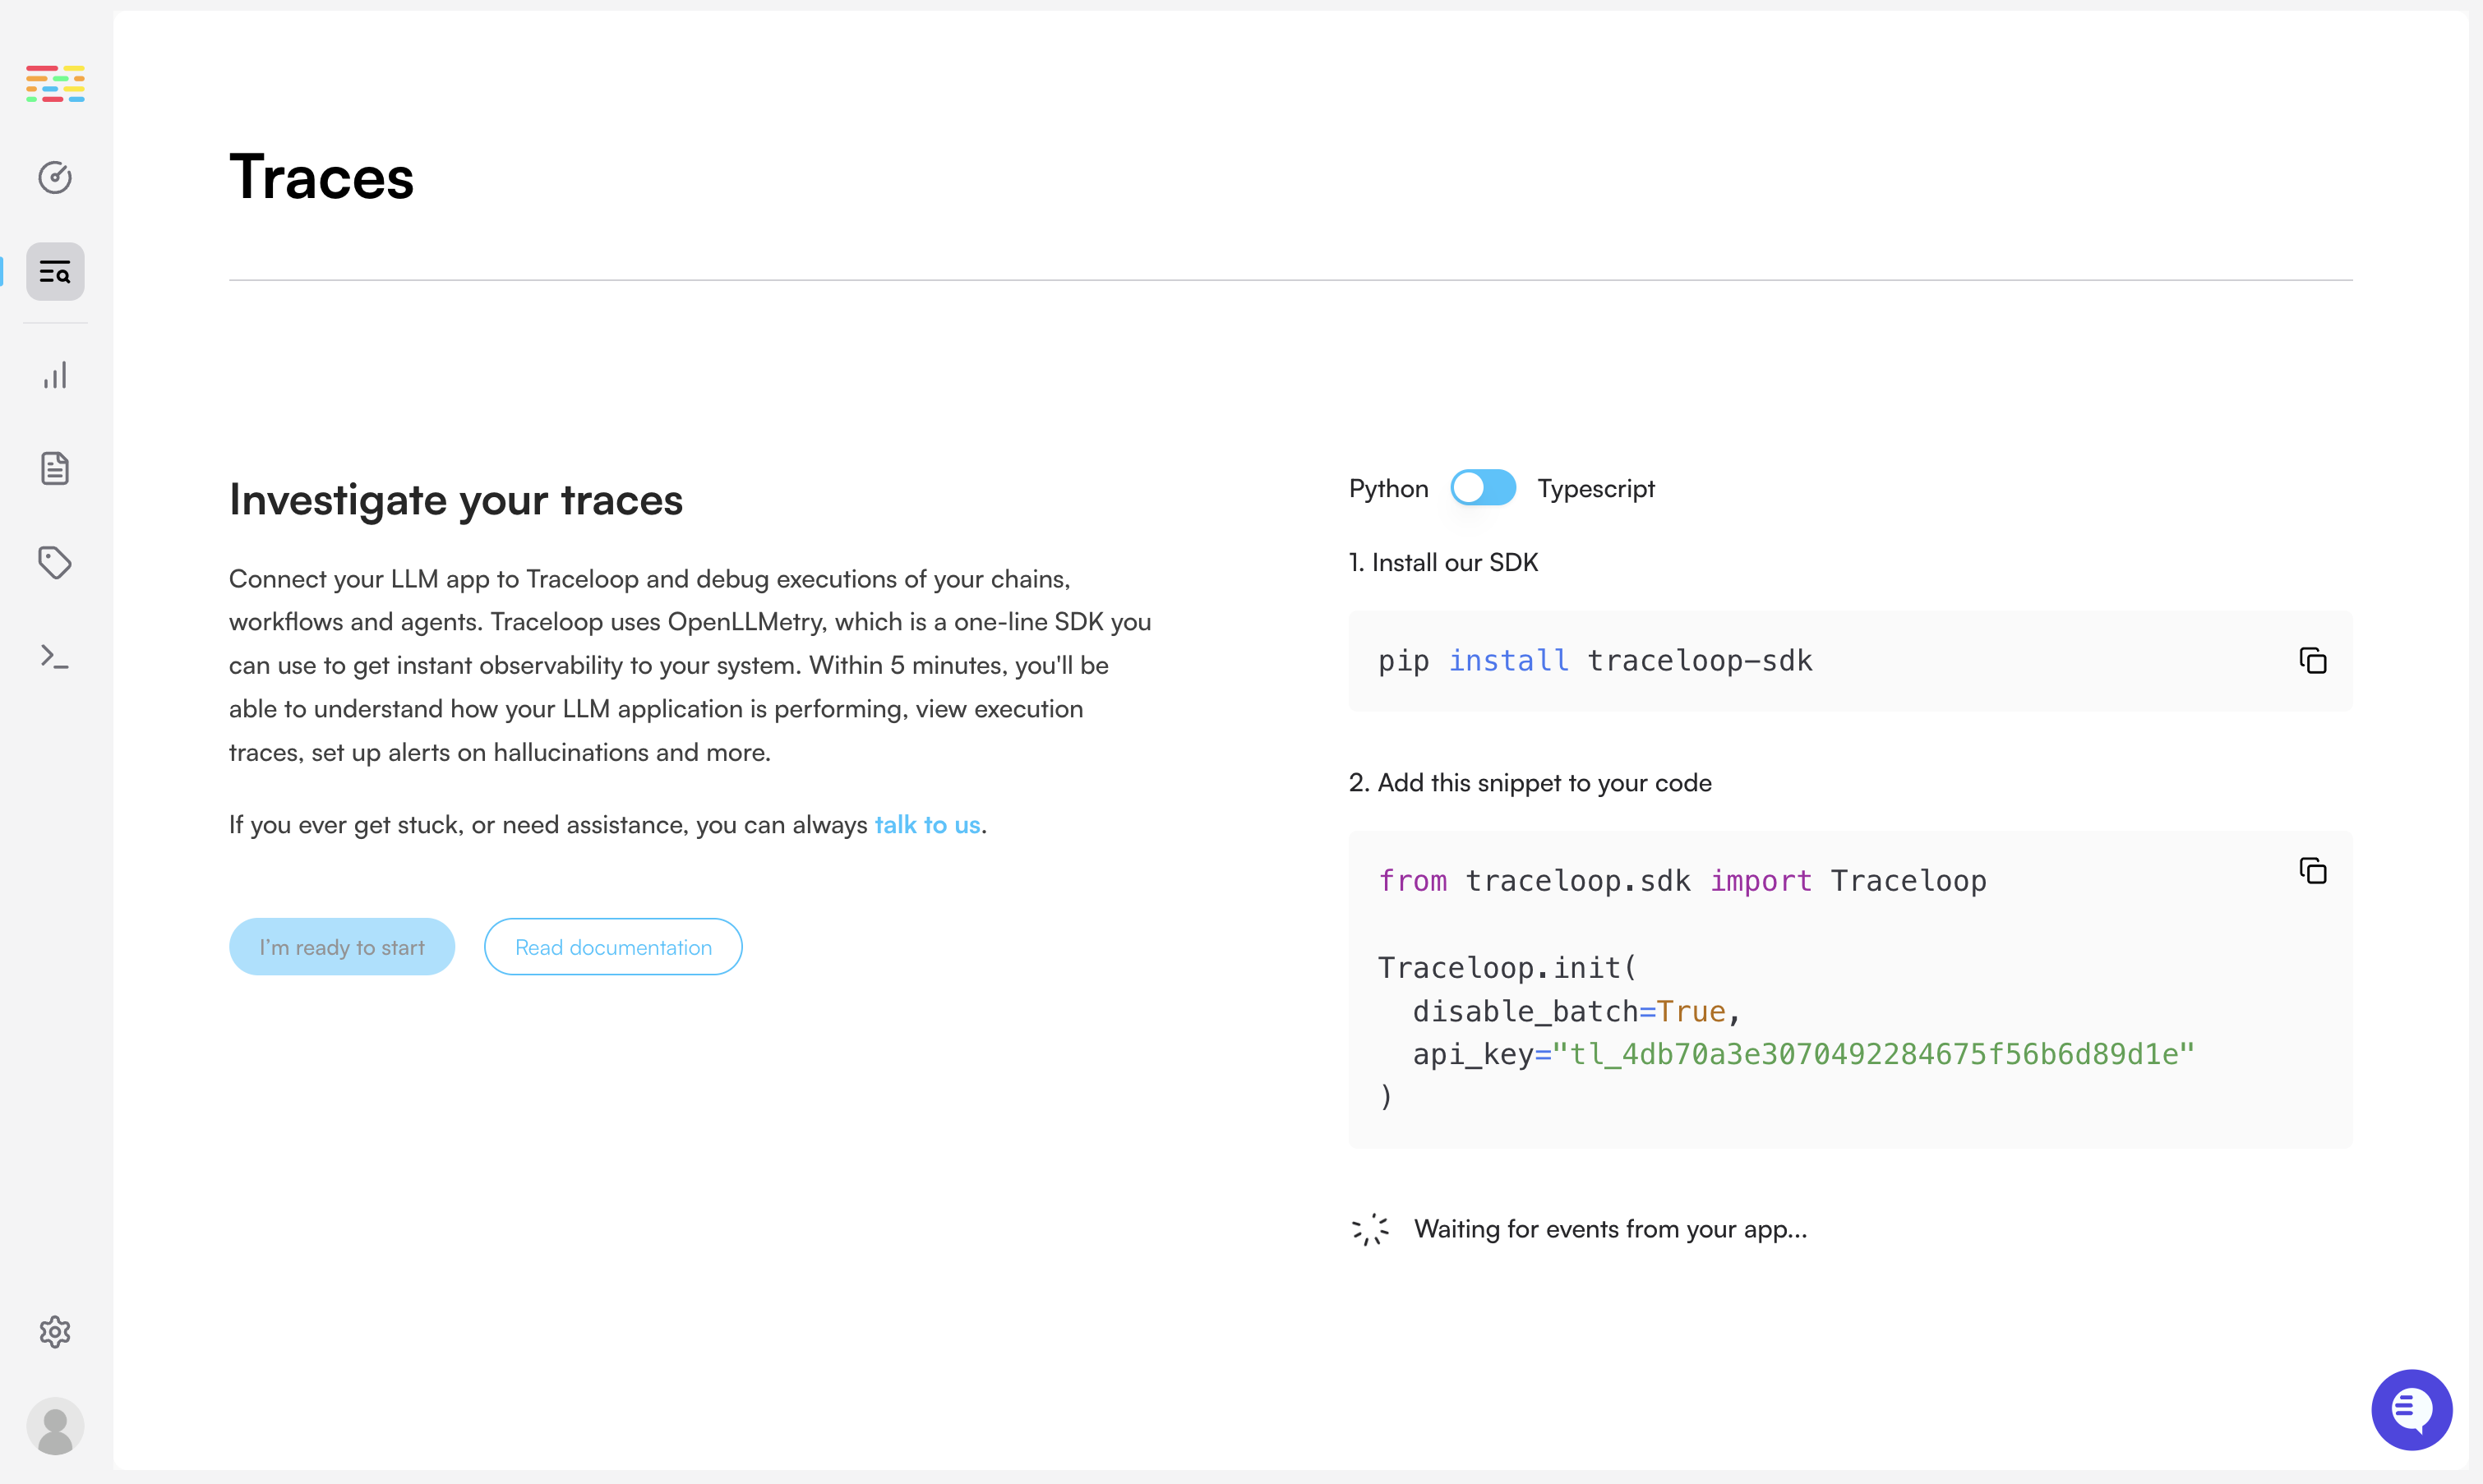
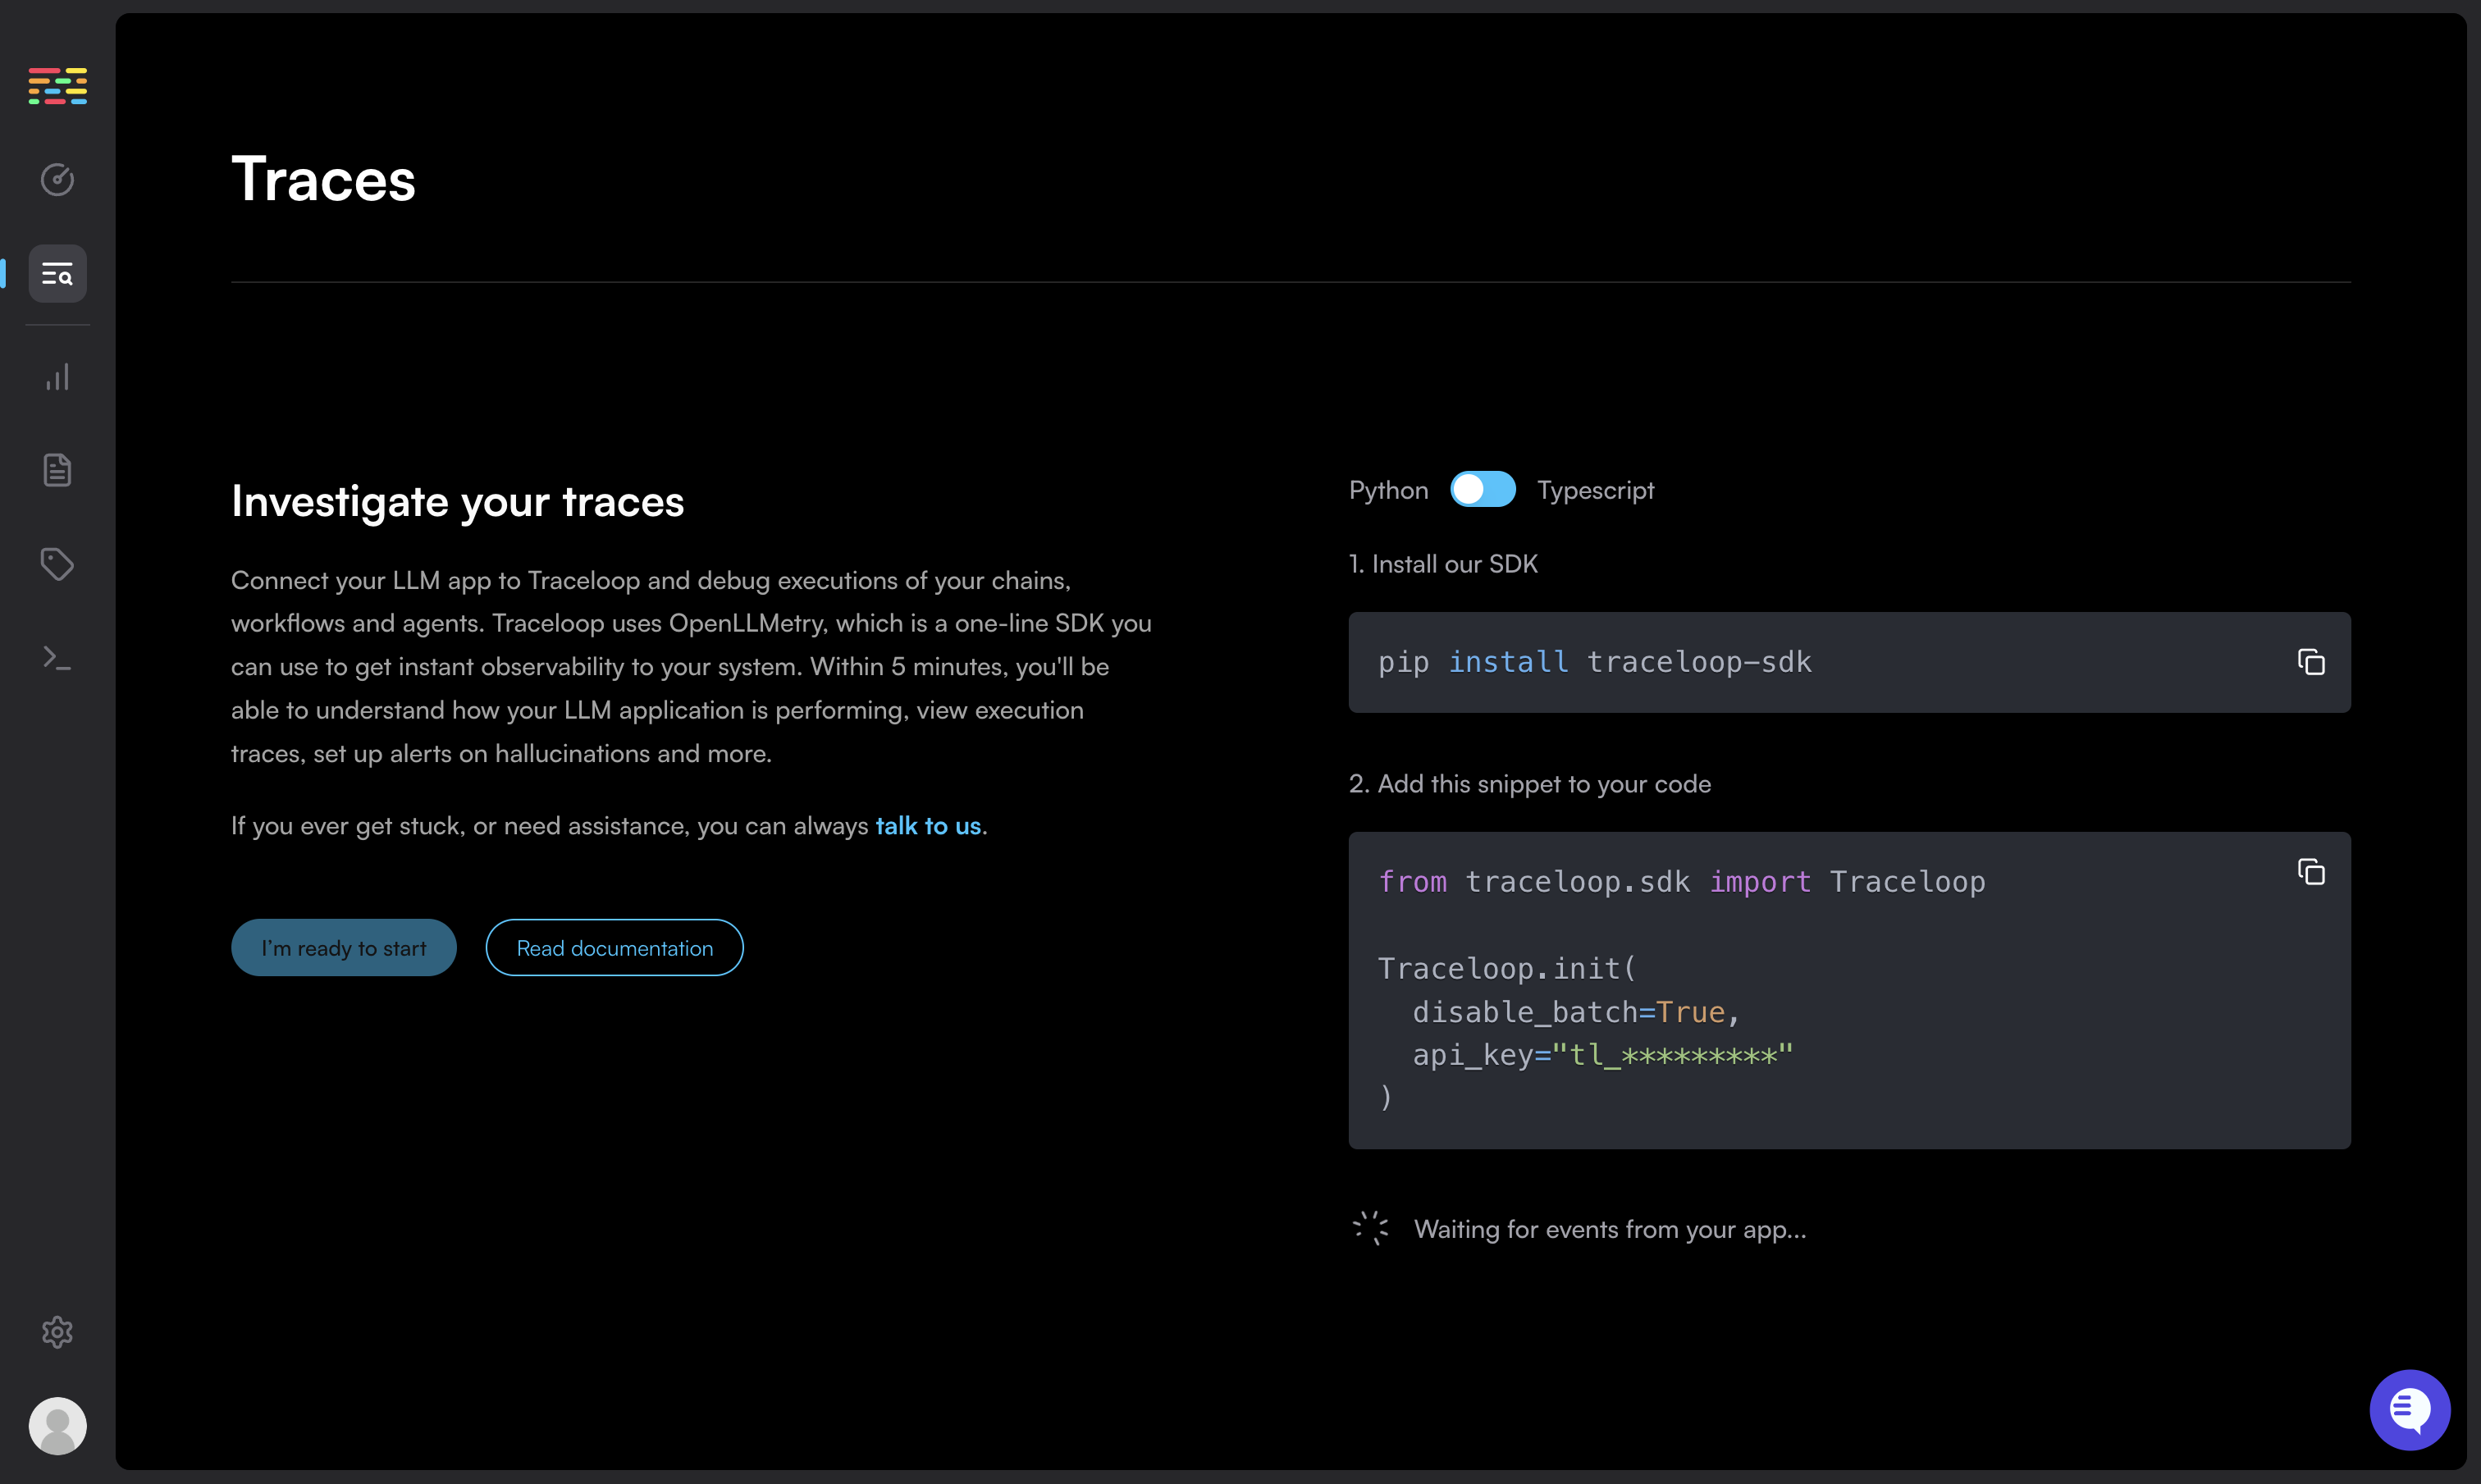 We've all been there. You followed all the instructions, but you're not seeing any traces. Let's fix this.
## 1. Disable batch sending
Sending traces in batch is useful in production, but can be confusing if you're working locally.
Make sure you've [disabled batch sending](/openllmetry/configuration#disable-batch).
```python Python theme={null}
Traceloop.init(disable_batch=True)
```
```js Typescript / Javascript theme={null}
Traceloop.init({ disableBatch: true });
```
## 2. Check the logs
When Traceloop initializes, it logs a message to the console, specifying the endpoint that it uses.
If you don't see that, you might not be initializing the SDK properly.
> **Traceloop exporting traces to `https://api.traceloop.com`**
## 3. (TS/JS only) Fix known instrumentation issues
If you're using Typescript or Javascript, make sure to import traceloop before any other LLM libraries.
This is because traceloop needs to instrument the libraries you're using, and it can only do that if it's imported first.
```js theme={null}
import * as traceloop from "@traceloop/traceloop";
import OpenAI from "openai";
...
```
If that doesn't work, you may need to manually instrument the libraries you're using.
See the [manual instrumentation guide](/openllmetry/tracing/js-force-instrumentations) for more details.
```js theme={null}
import OpenAI from "openai";
import * as LlamaIndex from "llamaindex";
traceloop.initialize({
appName: "app",
instrumentModules: {
openAI: OpenAI,
llamaIndex: LlamaIndex,
// Add or omit other modules you'd like to instrument
},
```
## 4. Is your library supported yet?
Check out [OpenLLMetry](https://github.com/traceloop/openllmetry#readme) or [OpenLLMetry-JS](https://github.com/traceloop/openllmetry-js#readme) README files to see which libraries and versions are currently supported.
Contributions are always welcome! If you want to add support for a library, please open a PR.
## 5. Try outputting traces to the console
Use the `ConsoleExporter` and check if you see traces in the console.
```python Python theme={null}
from opentelemetry.sdk.trace.export import ConsoleSpanExporter
Traceloop.init(exporter=ConsoleSpanExporter())
```
```js Typescript / Javascript theme={null}
import { ConsoleSpanExporter } from "@opentelemetry/sdk-trace-node";
traceloop.initialize({ exporter: new ConsoleSpanExporter() });
```
If you see traces in the console, then you probable haven't configured the exporter properly.
Check the [integration guide](/openllmetry/integrations) again, and make sure you're using the right endpoint and API key.
## 6. Talk to us!
We're here to help.
Reach out any time over
[Slack](https://traceloop.com/slack),
[email](mailto:dev@traceloop.com), and we'd love to assist you.
We've all been there. You followed all the instructions, but you're not seeing any traces. Let's fix this.
## 1. Disable batch sending
Sending traces in batch is useful in production, but can be confusing if you're working locally.
Make sure you've [disabled batch sending](/openllmetry/configuration#disable-batch).
```python Python theme={null}
Traceloop.init(disable_batch=True)
```
```js Typescript / Javascript theme={null}
Traceloop.init({ disableBatch: true });
```
## 2. Check the logs
When Traceloop initializes, it logs a message to the console, specifying the endpoint that it uses.
If you don't see that, you might not be initializing the SDK properly.
> **Traceloop exporting traces to `https://api.traceloop.com`**
## 3. (TS/JS only) Fix known instrumentation issues
If you're using Typescript or Javascript, make sure to import traceloop before any other LLM libraries.
This is because traceloop needs to instrument the libraries you're using, and it can only do that if it's imported first.
```js theme={null}
import * as traceloop from "@traceloop/traceloop";
import OpenAI from "openai";
...
```
If that doesn't work, you may need to manually instrument the libraries you're using.
See the [manual instrumentation guide](/openllmetry/tracing/js-force-instrumentations) for more details.
```js theme={null}
import OpenAI from "openai";
import * as LlamaIndex from "llamaindex";
traceloop.initialize({
appName: "app",
instrumentModules: {
openAI: OpenAI,
llamaIndex: LlamaIndex,
// Add or omit other modules you'd like to instrument
},
```
## 4. Is your library supported yet?
Check out [OpenLLMetry](https://github.com/traceloop/openllmetry#readme) or [OpenLLMetry-JS](https://github.com/traceloop/openllmetry-js#readme) README files to see which libraries and versions are currently supported.
Contributions are always welcome! If you want to add support for a library, please open a PR.
## 5. Try outputting traces to the console
Use the `ConsoleExporter` and check if you see traces in the console.
```python Python theme={null}
from opentelemetry.sdk.trace.export import ConsoleSpanExporter
Traceloop.init(exporter=ConsoleSpanExporter())
```
```js Typescript / Javascript theme={null}
import { ConsoleSpanExporter } from "@opentelemetry/sdk-trace-node";
traceloop.initialize({ exporter: new ConsoleSpanExporter() });
```
If you see traces in the console, then you probable haven't configured the exporter properly.
Check the [integration guide](/openllmetry/integrations) again, and make sure you're using the right endpoint and API key.
## 6. Talk to us!
We're here to help.
Reach out any time over
[Slack](https://traceloop.com/slack),
[email](mailto:dev@traceloop.com), and we'd love to assist you.