> ## Documentation Index
> Fetch the complete documentation index at: https://www.traceloop.com/docs/llms.txt
> Use this file to discover all available pages before exploring further.
# LLM Observability with Elasticsearch APM Service
Connect OpenLLMetry to [Elastic APM](https://www.elastic.co/guide/en/apm/guide/current/index.html) to visualize LLM traces in Kibana's native APM interface. This integration uses OpenTelemetry Protocol (OTLP) to route traces from your application through an OpenTelemetry Collector to Elastic APM Server.
This integration requires an OpenTelemetry Collector to route traces between Traceloop OpenLLMetry client and Elastic APM Server.
Elastic APM Server 8.x+ supports OTLP natively.
## Quick Start
Install the Traceloop SDK alongside your LLM provider client:
```bash theme={null}
pip install traceloop-sdk openai
```
Configure your OpenTelemetry Collector to receive traces from OpenLLMetry and forward them to APM Server.
Create an `otel-collector-config.yaml` file:
```yaml theme={null}
receivers:
otlp:
protocols:
http:
endpoint: localhost:4318
grpc:
endpoint: localhost:4317
processors:
batch:
timeout: 10s
send_batch_size: 1024
memory_limiter:
check_interval: 1s
limit_mib: 512
resource:
attributes:
- key: service.name
action: upsert
value: your-service-name # Match this to app_name parameter value when calling Traceloop.init()
exporters:
# Export to APM Server via OTLP
otlp/apm:
endpoint: http://localhost:8200 # APM Server Endpoint
tls:
insecure: true # Allow insecure connection from OTEL Collector to APM Server (for demo purposes)
compression: gzip
# Logging exporter for debugging (can ignore if not needed)
logging:
verbosity: normal # This is the verbosity of the logging
sampling_initial: 5
sampling_thereafter: 200
# Debug exporter to verify trace data
debug:
verbosity: detailed
sampling_initial: 10
sampling_thereafter: 10
extensions:
health_check:
endpoint: localhost:13133 # Endpoint of OpenTelemetry Collector's health check extension
service:
extensions: [health_check] # Enable health check extension
pipelines:
traces:
receivers: [otlp]
processors: [memory_limiter, batch, resource]
exporters: [otlp/apm, logging, debug]
metrics:
receivers: [otlp]
processors: [memory_limiter, batch, resource]
exporters: [otlp/apm, logging]
logs:
receivers: [otlp]
processors: [memory_limiter, batch, resource]
exporters: [otlp/apm, logging]
```
In production, enable TLS and use APM Server secret tokens for authentication.
Set `tls.insecure: false` and configure `headers: Authorization: Bearer `.
Import and initialize Traceloop before any LLM imports:
```python theme={null}
from os import getenv
from traceloop.sdk import Traceloop
from openai import OpenAI
# Initialize Traceloop with OTLP endpoint
Traceloop.init(
app_name="your-service-name",
api_endpoint="http://localhost:4318"
)
# Traceloop must be initialized before importing the LLM client
# Traceloop instruments the OpenAI client automatically
client = OpenAI(api_key=getenv("OPENAI_API_KEY"))
# Make LLM calls - automatically traced
response = client.chat.completions.create(
model="gpt-4o-mini",
messages=[{"role": "user", "content": "Hello!"}]
)
```
The `app_name` parameter sets the service name visible in Kibana APM's service list.
Navigate to Kibana's APM interface:
1. Open Kibana at `http://localhost:5601`
2. Go to **Observability → APM → Services**
3. Click on your service name (e.g., `your-service-name`)
4. View transactions and trace timelines with full LLM metadata
Each LLM call appears as a span containing:
* Model name (`gen_ai.request.model`)
* Token usage (`gen_ai.usage.input_tokens`, `gen_ai.usage.output_tokens`)
* Prompts and completions (configurable)
* Request duration and latency
## Environment Variables
Configure OpenLLMetry behavior using environment variables:
| Variable | Description | Default |
| ------------------------- | -------------------------------- | ----------------------- |
| `TRACELOOP_BASE_URL` | OpenTelemetry Collector endpoint | `http://localhost:4318` |
| `TRACELOOP_TRACE_CONTENT` | Capture prompts/completions | `true` |
Set `TRACELOOP_TRACE_CONTENT=false` in production to prevent logging sensitive prompt content.
## Using Workflow Decorators
For complex applications with multiple steps, use workflow decorators to create hierarchical traces:
```python theme={null}
from os import getenv
from traceloop.sdk import Traceloop
from traceloop.sdk.decorators import workflow, task
from openai import OpenAI
Traceloop.init(
app_name="recipe-service",
api_endpoint="http://localhost:4318",
)
# Traceloop must be initialized before importing the LLM client
# Traceloop instruments the OpenAI client automatically
client = OpenAI(api_key=getenv("OPENAI_API_KEY"))
@task(name="generate_recipe")
def generate_recipe(dish: str):
"""LLM call - creates a child span"""
response = client.chat.completions.create(
model="gpt-4o-mini",
messages=[
{"role": "system", "content": "You are a chef."},
{"role": "user", "content": f"Recipe for {dish}"}
]
)
return response.choices[0].message.content
@workflow(name="recipe_workflow")
def create_recipe(dish: str, servings: int):
"""Parent workflow - creates the root transaction"""
recipe = generate_recipe(dish)
return {"recipe": recipe, "servings": servings}
# Call the workflow
result = create_recipe("pasta carbonara", 4)
```
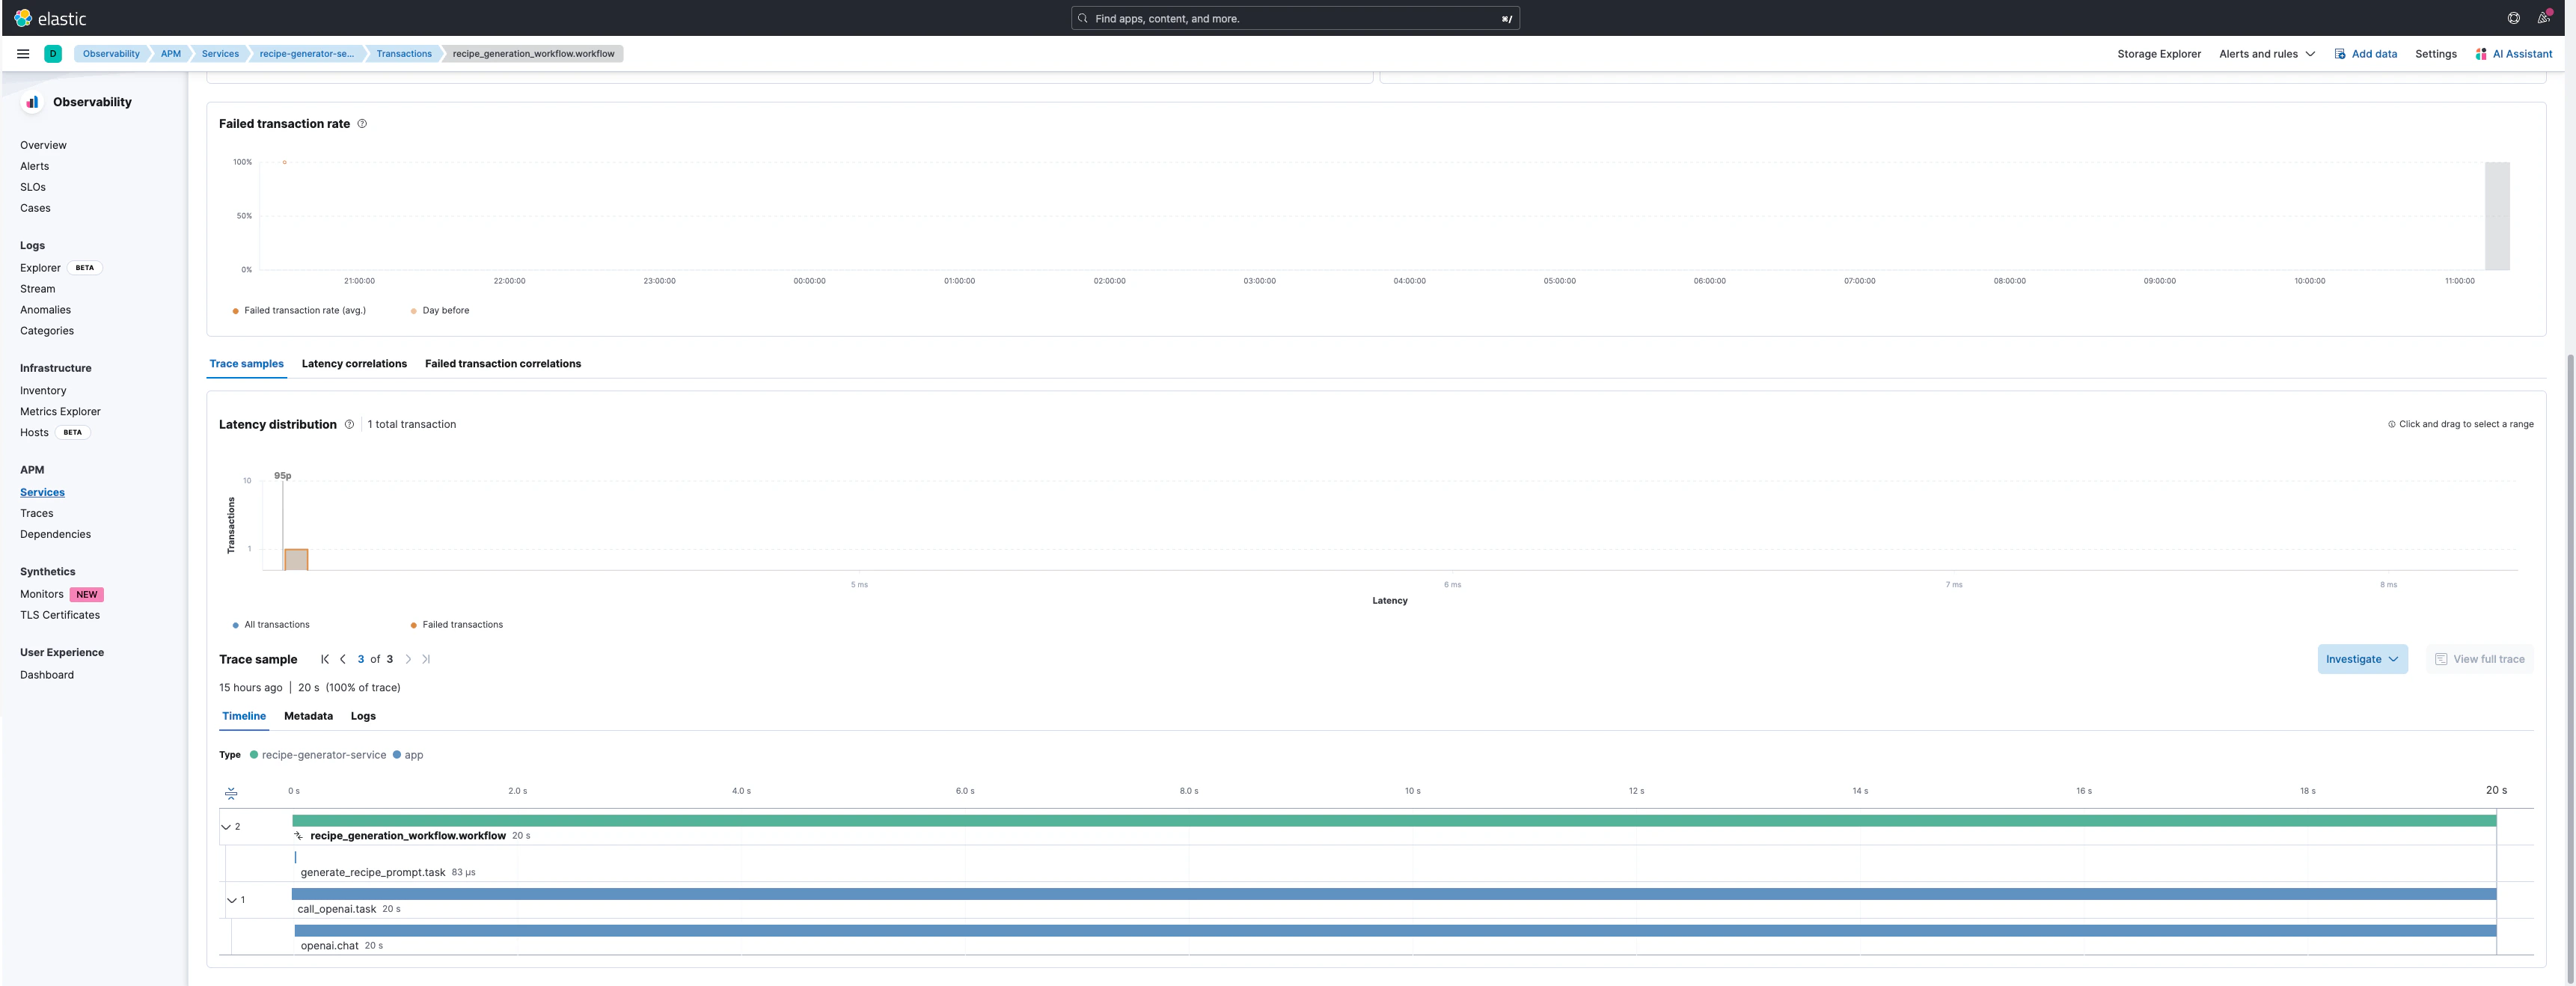
In Kibana APM, you'll see:
* `recipe_workflow.workflow` as the parent transaction
* `generate_recipe.task` as a child span
* `openai.chat.completions` as the LLM API span with full metadata
## Example Trace Visualization
### Trace View
 ### Trace Details
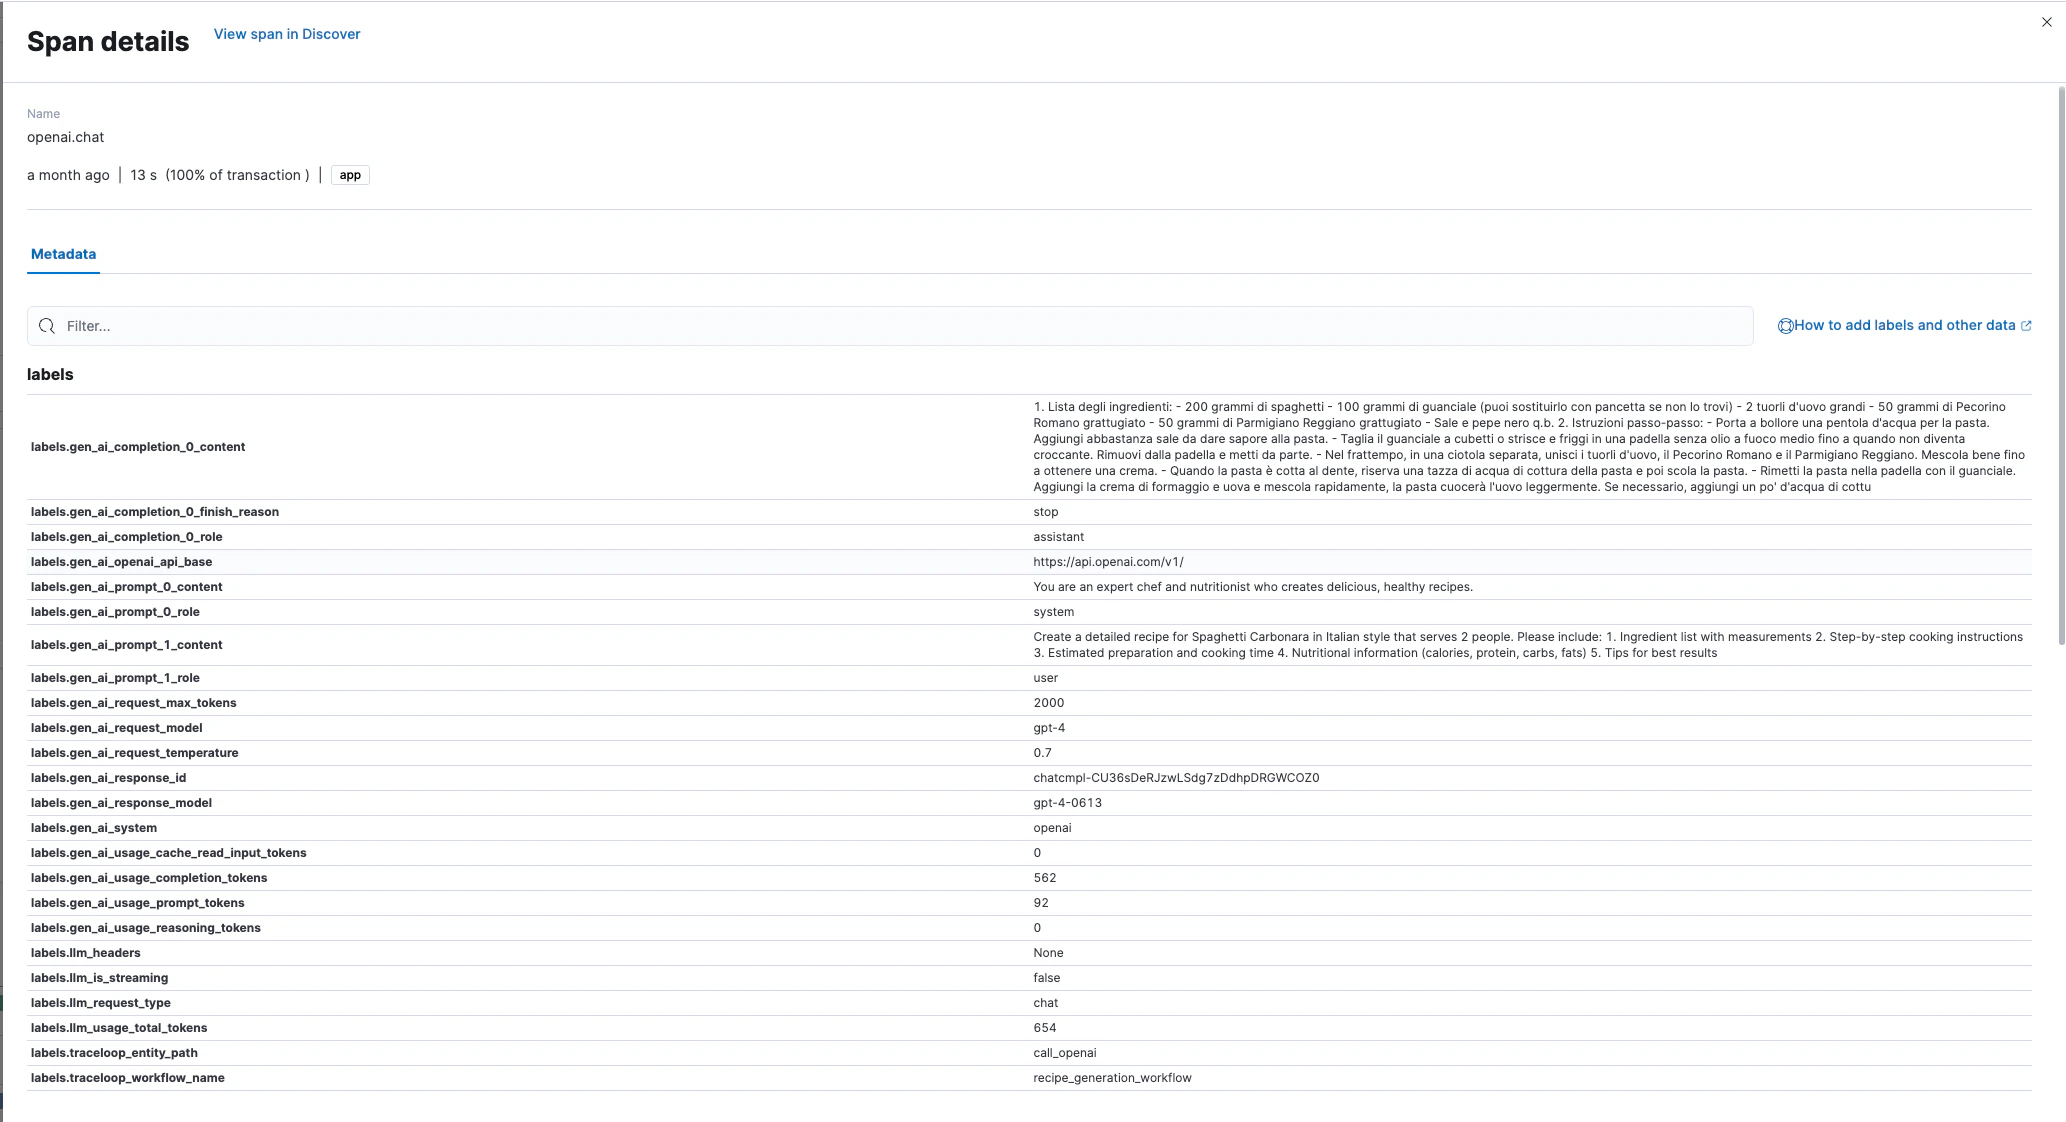 ## Captured Metadata
OpenLLMetry automatically captures these attributes in each LLM span:
**Request Attributes:**
* `gen_ai.request.model` - Model identifier
* `gen_ai.request.temperature` - Sampling temperature
* `gen_ai.system` - Provider name (OpenAI, Anthropic, etc.)
**Response Attributes:**
* `gen_ai.response.model` - Actual model used
* `gen_ai.response.id` - Unique response identifier
* `gen_ai.response.finish_reason` - Completion reason
**Token Usage:**
* `gen_ai.usage.input_tokens` - Input token count
* `gen_ai.usage.output_tokens` - Output token count
* `llm.usage.total_tokens` - Total tokens
**Content (if enabled):**
* `gen_ai.prompt.{N}.content` - Prompt messages
* `gen_ai.completion.{N}.content` - Generated completions
## Production Considerations
Disable prompt/completion logging in production:
```bash theme={null}
export TRACELOOP_TRACE_CONTENT=false
```
This prevents sensitive data from being stored in Elasticsearch.
Configure sampling in the OpenTelemetry Collector to reduce trace volume:
```yaml theme={null}
processors:
probabilistic_sampler:
sampling_percentage: 10 # Sample 10% of traces
```
Enable APM Server authentication:
```yaml theme={null}
exporters:
otlp/apm:
endpoint: https://localhost:8200
headers:
Authorization: "Bearer "
tls:
insecure: false
```
## Resources
* [Elastic APM Documentation](https://www.elastic.co/docs/solutions/observability/apm)
* [OpenTelemetry Collector Configuration](https://opentelemetry.io/docs/collector/configuration/)
* [Traceloop SDK Configuration](https://www.traceloop.com/docs/openllmetry/configuration)
## Captured Metadata
OpenLLMetry automatically captures these attributes in each LLM span:
**Request Attributes:**
* `gen_ai.request.model` - Model identifier
* `gen_ai.request.temperature` - Sampling temperature
* `gen_ai.system` - Provider name (OpenAI, Anthropic, etc.)
**Response Attributes:**
* `gen_ai.response.model` - Actual model used
* `gen_ai.response.id` - Unique response identifier
* `gen_ai.response.finish_reason` - Completion reason
**Token Usage:**
* `gen_ai.usage.input_tokens` - Input token count
* `gen_ai.usage.output_tokens` - Output token count
* `llm.usage.total_tokens` - Total tokens
**Content (if enabled):**
* `gen_ai.prompt.{N}.content` - Prompt messages
* `gen_ai.completion.{N}.content` - Generated completions
## Production Considerations
Disable prompt/completion logging in production:
```bash theme={null}
export TRACELOOP_TRACE_CONTENT=false
```
This prevents sensitive data from being stored in Elasticsearch.
Configure sampling in the OpenTelemetry Collector to reduce trace volume:
```yaml theme={null}
processors:
probabilistic_sampler:
sampling_percentage: 10 # Sample 10% of traces
```
Enable APM Server authentication:
```yaml theme={null}
exporters:
otlp/apm:
endpoint: https://localhost:8200
headers:
Authorization: "Bearer "
tls:
insecure: false
```
## Resources
* [Elastic APM Documentation](https://www.elastic.co/docs/solutions/observability/apm)
* [OpenTelemetry Collector Configuration](https://opentelemetry.io/docs/collector/configuration/)
* [Traceloop SDK Configuration](https://www.traceloop.com/docs/openllmetry/configuration)